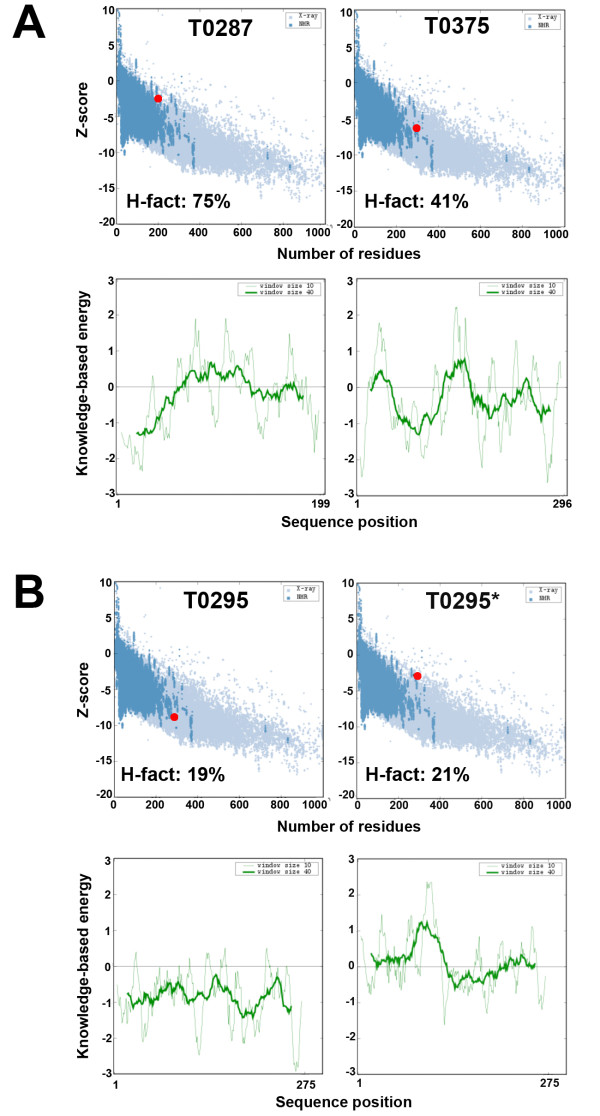
Figure 6.
Comparison between the H-Factor and ProSA. ProSA-Web analysis of the average model generated for three CASP7 targets: A. T0287 and T0375. B. T0295 and T0295*. The test case T0295* corresponds to T0295 with a modified sequence alignment used to generate the models (see figure 2 for details). The H-factors for the same models are given for comparison.

