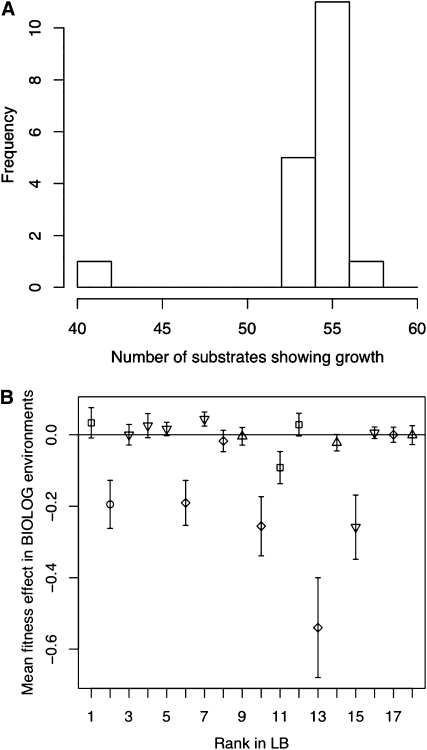
Figure 1 .
Patterns of ecological specialization of the 18 beneficial mutations. (A) Distribution of number of environments showing growth in the top 18 mutants. Note that the niche breadth of the ancestral type is at the mode of the distribution (i.e., could grow in 55 environments). (B) Mean fitness effects (averaged across all carbon sources) of the top 18 mutants. Rank is based on the performance in the initial environment (LB). Symbols designate known (to date) mutations in the 500-bp region of the gyrA QRDR: □, Asp87Gly; ○, Asp87Ala; ▿, WT; ⋄, Asp87Tyr; ▵, Thr83Ile.

