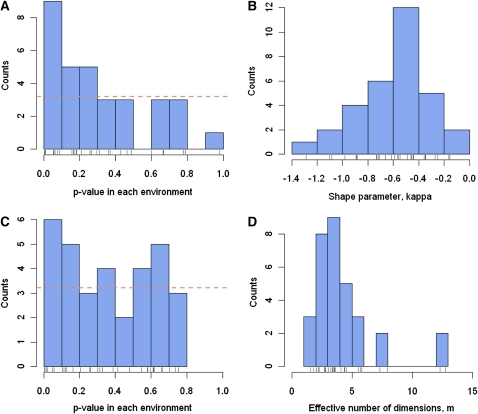
Figure 3 .
Meta-analysis of the DFE across environments. (A) Distribution of P-values associated with the test of the departure from an exponential DFE in each environment. The horizontal line denotes the expected counts of P-values in each bin on the basis of the global null hypothesis that DFE is exponential in every environment. (B) Distribution of the shape parameter, κ, of the DFE of beneficial mutations in each environment. κ was estimated in each environment using an estimator proposed by Rokyta et al. (2008) that is more accurate than maximum-likelihood estimates when the shape parameter is negative. (C) Distribution of P-values associated with LRT for the departure from the null hypothesis of a constrained β-distribution for DFE in each environment. The horizontal line denotes the expected counts of P-values in each bin based on the global null hypothesis that DFE is a constrained β, Be[1,b], in every environment. (D) Distribution of the effective number of independent phenotypic traits, m, describing Fisher’s geometric landscape in each environment. Estimates of m are based on the theoretical relationship between m and the shape parameter (κ) of the DFE of beneficial mutations (κ).

