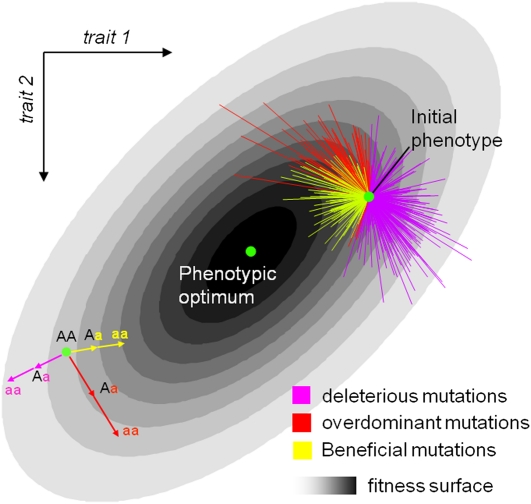
Figure 2.
Two-dimensional illustration of the mutation model. This figure illustrates the principle of the model in two dimensions (two traits). The fitness function is a bivariate Gaussian function, which increases toward an optimum with darker gray shading. Mutants are distributed around an initial phenotype or wild type (green spot). The bottom-left sketch explains how dominance on fitness arises even when the phenotype of the heterozygous mutant is halfway between the initial and the homozygous phenotype (additive phenotypes). The top-right sketch shows how a random draw of mutants around an initial phenotype (green spot) generates a distribution of homozygote and heterozygote fitness effects. Any model of stabilizing selection naturally generates dominance for fitness even when mutations act additively on the underlying phenotype. This is due to the concavity of the fitness surface around the optimum. With such a surface, deleterious mutations (purple) tend to be recessive because if a step in one direction is deleterious (i.e., it increases the distance to the optimum), two steps in the same direction necessarily result in more than twice the deleterious effect. The reverse is true for beneficial mutations (yellow) that tend to be dominant. Interestingly, this model also predicts that some mutations (red) should exhibit overdominance in their fitness effect if mutations that bring the phenotype close to the optimum in one step overshoot it in two steps in the same direction.

