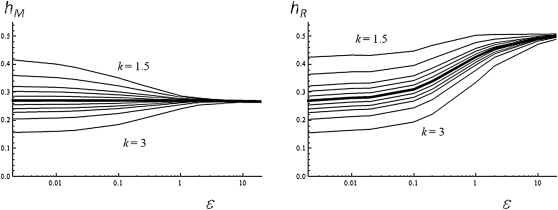
Figure 7.
Peakedness of the fitness function. Effect of the peakedness of the fitness function (k, as described in the text) on average dominance (hM, left; hR, right) as a function of the scaled distance to the optimum ε = so/E(shom). The case of a quadratic log-fitness (k = 2) is indicated by the thick line (other k values are from top to bottom: k = 1.5; 1.7; 1.8; 1.9; 2; 2.1; 2.2; 2.3; 2.5; 3). Average measure obtained by simulations (E(shom) = 0.05; συ2 = 0.02).

