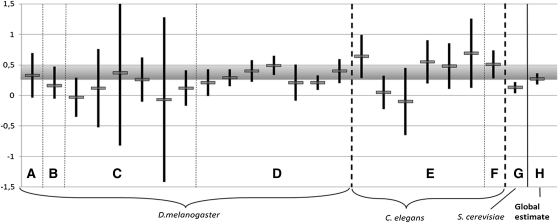
Figure 9.
Survey of empirical estimates of average dominance. We confronted our prediction (hR within [0.25–0.5] and closer to 0.25, shaded region) with different empirical estimates of hR (with their confidence interval), across species and different traits. D. melanogaster: (A) viability (Chavarrias et al. 2001), (B) viability (Fry and Nuzhdin 2003), (C) female early fecundity, female late fecundity, male longevity, female longevity, male mating ability, weighted mean (not used to calculate our composite estimate of average dominance) (Houle et al. 1997), (D) viability, recalculated hR from different Mukai’s experiments (Simmons and Crow 1977). C. elegans: (E) productivity, survival to maturity, longevity, intrinsic rate of increase, convergence rate, generation rate (Vassilieva et al. 2000), (F) relative fitness (Peters et al. 2003). Saccharomyces cerevisiae, (G) growth rate (Szafraniec et al. 2003). (H) Composite weighted estimate of hR across studies 0.27 [CI 0.18–0.36].

