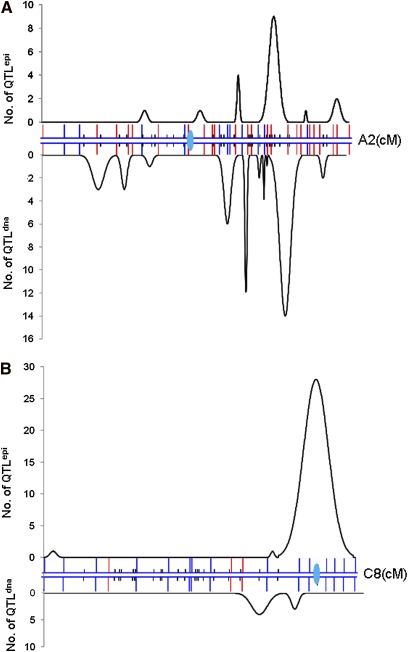
Figure 3 .
Distribution of consensus QTLepi on the I-map linkage groups. (A) Distribution of QTLepi and QTLdna on linkage group A2. (B) Distribution of QTLepi and QTLdna on linkage group C8. The curves above and below the LG represent QTLepi and QTLdna, regardless of LOD value, and take into account solely the number of QTL. The height of the curve represents the frequency of QTL detected, and the width of the baseline of the curve represents the extent of confidence intervals for the QTL in that region.

