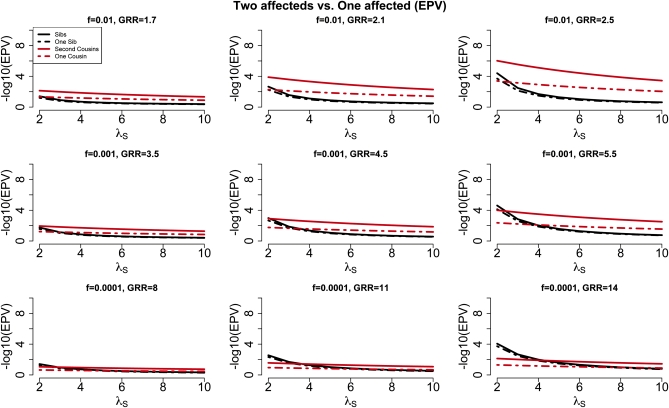
Figure 4.
For complex traits with a large value for λS (e.g., λS = 22 for autism) we show expected P-values for a disease locus with frequency f = 0.001 as a function of the GRR for five study designs, each with 2000 affected individuals: 1000 sib-pairs, 1000 first-cousin pairs, 1000 second-cousin pairs, 2000 unrelateds, and 2000 unrelated individuals known to have an affected sibling (i.e., unrelateds+).

