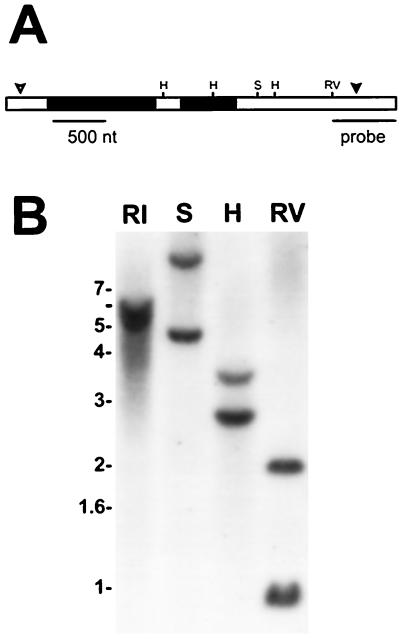
Figure 5.
Gene structure of Gtr1 and evidence for two Gtr genes. A, Representation of Gtr1 showing three exons (white bars) and two introns (black bars). Restriction sites are shown for HindIII (H), SphI (S), and EcoRV (RV). The open and closed arrowheads denote the translation start and termination sites, respectively. The probe used for the Southern analysis in B is shown. B, Southern analysis of soybean DNA cut with EcoRI (RI), SphI (S), HindIII (H), or EcoRV (RV).

