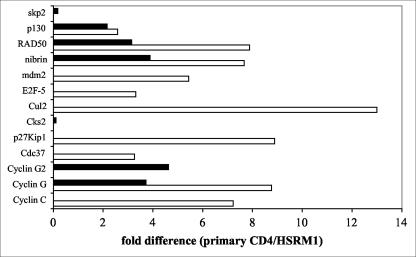
FIG. 4.
Cell cycle-related gene expression analysis of primary CD4+ T cells and the HSRM1 cell line. Primary CD4+ T cells from four SIV-negative RM and two independent preparations of HSRM1 cells were cultured in medium (nonstimulated; white bars) or stimulated with anti-CD3 antibody-coated beads for 16 h (black bars), and transcription of cell cycle-related factors was determined using the Cell Cycle GEArray Q series kit (SuperArray). The levels of gene transcription in each sample were normalized to the expression of the GAPDH gene, and mean values for the primary CD4+ T cells and HSRM1 cell line were derived. Data are expressed as fold difference of gene expression between the primary CD4+ T cells and the HSRM1 cell line, and only those genes showing more than a threefold difference in the expression (out of 96 genes tested) are shown.

