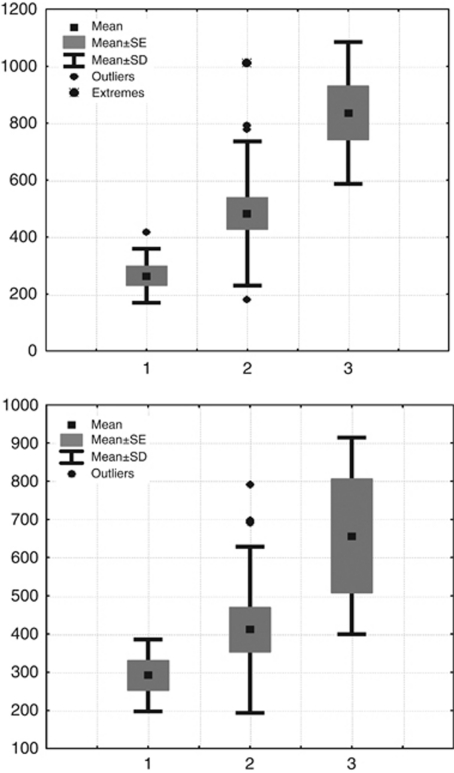
Figure 3.
Upper panel: Total retinal ablation area treated with laser for PDR. y axis: Retinal surface ablation area (mm2). x axis: Grade of PDR; mild—1, moderate—2, and severe—3. Lower panel: Total retinal ablation area treated to produce complete regression of PDR disease. y axis: Retinal surface ablation area (mm2). x axis: Grade of PDR; mild—1, moderate—2, and severe—3.

