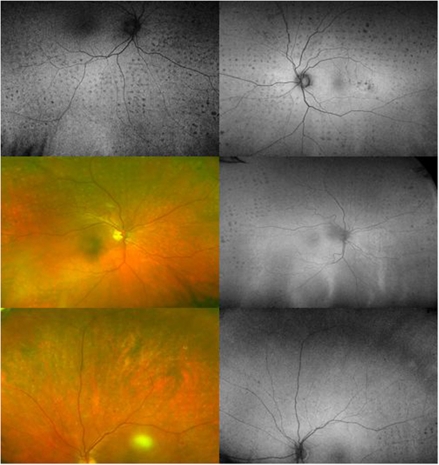
Figure 4.
Optos colour and autofluorescence images of treated proliferative disease. Upper right: At 22 months, the areas lacking autofluorescence correspond to laser burns. Upper left: At 12 months, the Pascal 5 × 5 multispot arrays contain laser lesions lacking autofluorescence of mixed spatial density, and there is no significant laser burn expansion. Middle left: Colour image showing partially visible laser burns at 17 months post laser. Middle right: Peripheral retinal zones show small areas lacking autofluorescence that map the panretinal laser coverage on the colour image (middle left). Lower left: At 22 months following primary panretinal photocoagulation, the colour image shows barely visible panretinal laser burns. Lower right: Autofluorescence image of the same patient (lower left), and the laser lesions show minimal changes in autofluorescence imaging and no signs of laser burn expansion at 22 months post laser.

