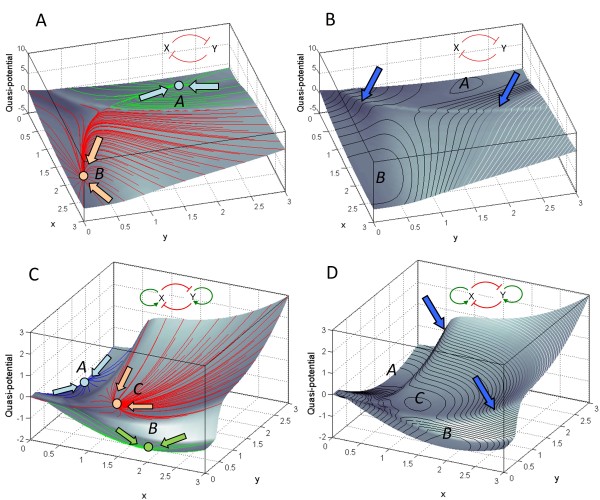
Figure 3.
Ridges and valleys on the computed epigenetic landscape of a bistable (A, B) and a tristable (C, D) regulatory network of two genes x and y. The alignment of trajectories produces the "ridges" on the epigenetic landscape (indicated by arrows in panels B and D) that separate the "valleys", or basins of attraction of multiple stable states of the network (points A, B and C). Equi-potential lines are drawn on the landscape to depict the curvature of the surface. In addition to the double-negative feedback loop between genes x and y that produces the bistable network (panels A and B), the tristable network (panels C and D) requires additional positive autoregulation of the two genes [8,13,42] (see Methods).

