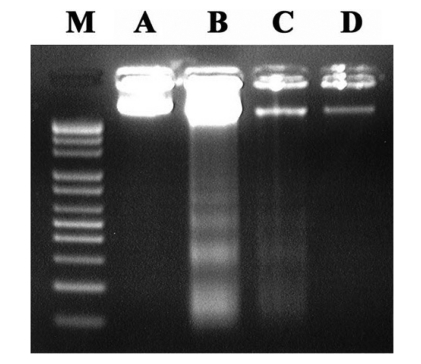
Fig. 5.
RT-PCR analysis of the mRNA levels of p53 and Bax. *Represents p<0.05 compared to the control group. #Represents p<0.05 compared to the SNP-treated group. (A) Control group, (B) 0.5 mM SNP-treated group, (C) 0.5 mg/ml CVEcitrus followed by 0.5 mM SNP group, (D) 1.0 mg/ml CVEcitrus followed by 0.5 mM SNP group.

