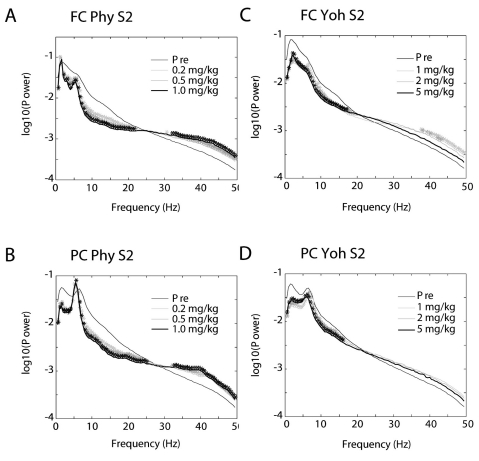
Fig. 1.
Power spectra of EEG from the frontal cortex (A, C) and the parietal (B, D) cortex of the second segment (S2, 15~30 min) after each dose of drugs. Significant changes in powers at each frequency bin of the mean spectra were produced by 3 doses of physostigmine (Phy: 0.2, 0.5 and 1.0 mg/kg) (A, B) and of yohimbine (Yoh: 1, 2 and 5 mg/kg) (C, D). *p<0.05, significantly different from the Pre. FC: frontal cortex, PC: parietal cortex, S2: the 2nd segment (15~30 min after a dose).

