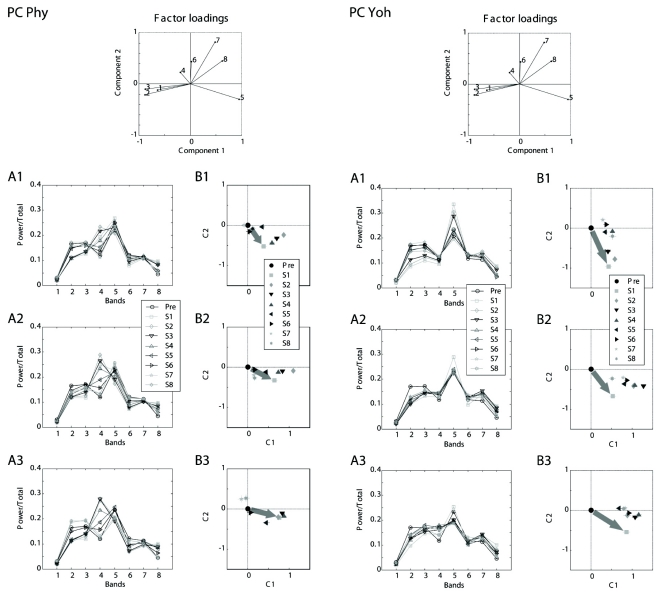
Fig. 5.
Projections to the reference canonical space of the EEG from the parietal cortex. The data sets of relative band powers fed to the multivariate statistics were shown on A1 to A3. Corresponding projection on the two-dimensional canonical space for the parietal cortex were depicted on B1 to B3. The mark of the center (0, 0) of each graph is the location of Pre and other symbol represents each of eight 15-min segments after one dose of drug injection. A1 and B1. low dose (Phy: 0.2 mg/kg and Yoh: 1 mg/kg); A2 and B2. intermediate dose (Phy: 0.5 mg/kg and Yoh: 2 mg/kg); and A3 and B3. high dose (Phy: 1 mg/kg and Yoh: 5 mg/kg). Large arrows on B1 to B3 display the direction and distance of projection of the first segment from the center. PC: parietal cortex, Phy: physostigmine, 1 to 8: eight bands, Pre: a period of 11:00~12:00, S1 to S8: the first to 8th segments (every 15 min period after a dose), C1 and C2: canonical variables.

