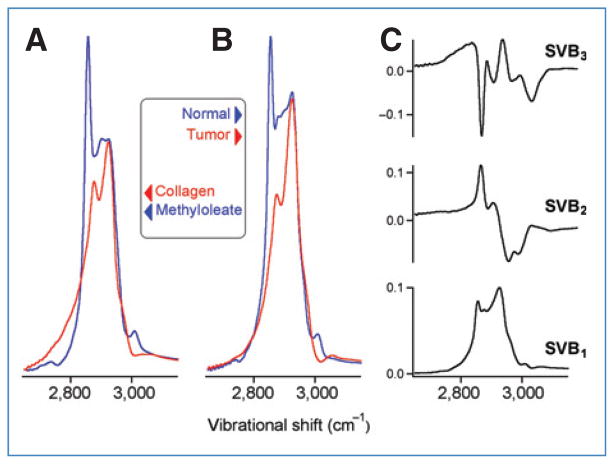
Figure 3.
Comparison of NIVI spectra. A, for reference, methyl oleate (a lipid) versus collagen (a protein). B, normal versus tumor. C, the first 3 basis spectra obtained by SVD of the normal and tumor spectral images. SVB1 is an average spectrum and contains little information to differentiate normal and tumor tissues. SVB2 and SVB3 highlight the most important differences between normal and tumor spectra resulting from relative changes in lipid versus protein composition as well as the degree of lipid saturation (small vibrational peak above 3,000 cm−1).

