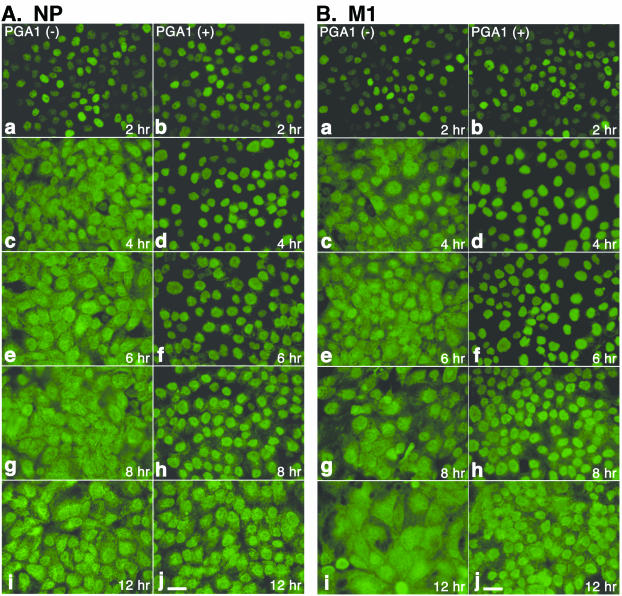
FIG. 5.
Distribution of NP and M1 in MDCK cells infected with PGA1. The cells treated with PGA1 (b, d, f, h, and j) or untreated cells (a, c, e, g, and i) were infected with the virus and fixed after culturing for 2 h (a and b), 4 h (c and d), 6 h (e and f), 8 h (g and h), or 12 h (i and j). The cells were stained with anti-NP (A) or -M1 (B) monoclonal antibody. NP and M1 remained in the nuclei in the cells treated with PGA1 until 8 h after infection. Bar, 25 μm.

