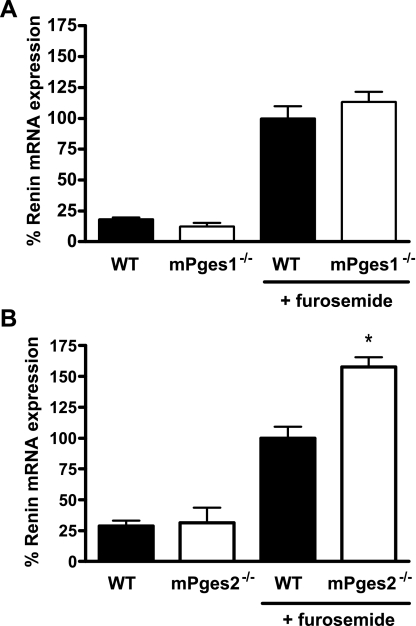
Fig. 7.
Furosemide stimulation of renin in mPGES1−/− (A) and mPGES2−/− (B) mice. Relative expression of renin mRNA was measured by real-time RT-PCR in kidneys of WT (filled bars) or mPGES−/− (open bars) mice treated with either vehicle or furosemide and is presented as percent of the furosemide-stimulated WT value. *P < 0.05 vs. WT by unpaired t-test.

