FIG. 2.
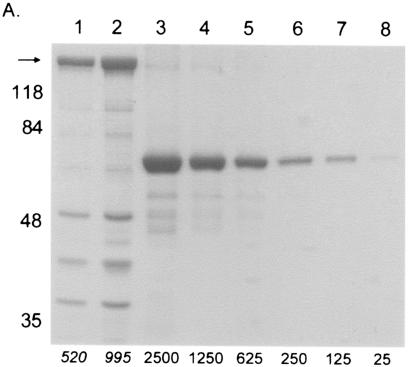
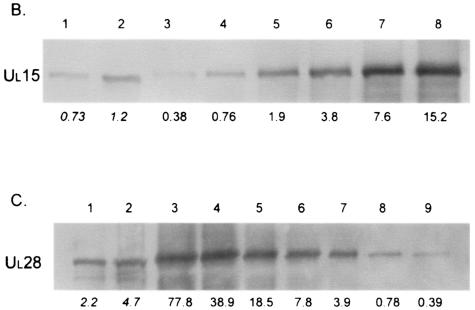
Data used for calculating the average number of copies of pUL15 or pUL28 in capsids. (A) Coomassie-stained gel with B capsids (lanes 1 and 2) and BSA standards (lanes 3 to 8). The amount of BSA (in nanograms) loaded is indicated at the bottom of lanes 3 to 8. The R2 value of the graph produced by analysis of the data was 0.98, and the estimated amount of VP5 (arrow) is indicated in italics below lanes 1 and 2. The positions of molecular weight standards are indicated on the left. (B) Immunoblot of B capsids (lanes 1 and 2) and purified UL15 protein standards (lanes 3 to 8) probed with antisera directed against pUL15. The amount of pUL15 (in nanograms) is indicated below each lane. (C) Immunoblot probed with antisera directed against pUL28. B capsids are in lanes 1 and 2, and purified UL28 protein standards are in lanes 3 to 9. The amount of pUL28 (in nanograms) is indicated below each lane.


