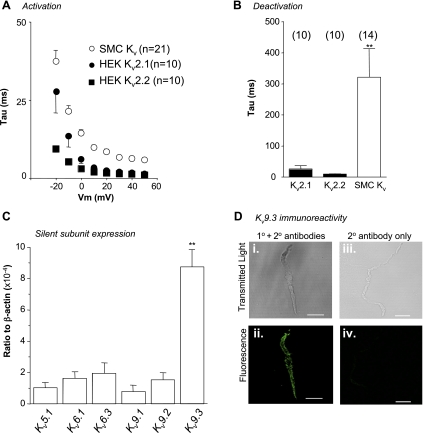
Fig. 7.
Evidence that RUSMC express silent Kv subunits. A: time constant of activation is plotted against voltage for native cells (○) and HEK cells expressing Kv2.1 (●) and Kv2.2 (■). B: deactivation time constant measured following a repolarizing step to −40 mV from 30 mV in native cells (n = 14) and HEK cells stably expressing Kv2.1 (n = 10) and Kv2.2 (n = 10). **P < 0.01. C: q-PCR data comparing the transcriptional expression of silent Kv subunits in the rabbit urethra. **P < 0.01. D: transmitted light and fluorescent images obtained from freshly dispersed RUSMC and incubated with anti-Kv9.3 primary and secondary (Di and Dii) antibodies, or with secondary antibody alone (Diii and Div).

