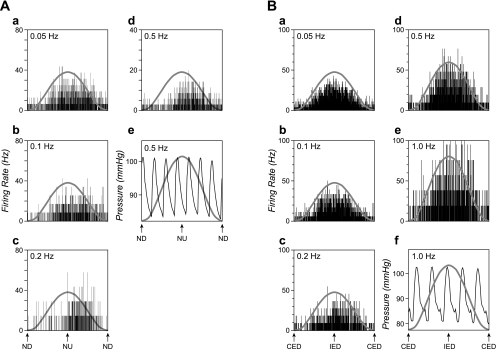
Fig. 5.
Averaged responses of two NTS units to sinusoidal rotations at different frequencies. Each histogram contains 500 bins (bin width varies from 40 ms at 0.05 Hz to 2 ms at 1 Hz). A sine wave superimposed on each trace shows table movement. A: responses of a unit with unknown visceral inputs to 5° rotations in the pitch plane. The number of sweeps averaged for each trace were 4 in a, 6 in b, 7 in c, and 91 in d. Panel e shows blood pressure recordings during one of the trials used to produce d; body tilt did not produce alterations in blood pressure. B: averaged responses of another unit with GI inputs to sinusoidal rotations in the roll plane. Rotation amplitudes were 7.5° at all frequencies but 1 Hz (e), where 5° rotations were delivered. Numbers of sweeps averaged for each trace were 7 in a, 9 in b, 12 in c, 26 in d, and 26 in e. Panel f shows blood pressure recordings during one of the trials used to produce e.

