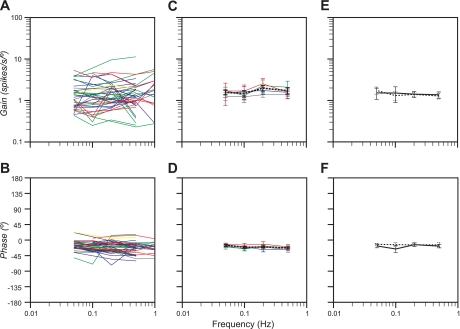
Fig. 6.
Bode plots illustrating the dynamic properties of NTS neuronal responses to tilt at multiple frequencies. Responses were plotted relative to stimulus position. A and B: individual Bode plots for each cell where responses to rotations were measured over at least a stimulus decade. Lines of different colors are used to designate each unit type, where red denotes cardiovascular units, yellow denotes respiratory units, green denotes GI units, blue denotes convergent units, and gray denotes unknown units. C and D: averages of the responses shown in A and B for the frequency range of 0.05–0.5 Hz; error bars designate means ± SE. The same colors were used to designate each unit type as in A and B. Since a Bode plot was generated for only one respiratory neuron, average data were not provided. Dashed lines in C and D indicate averaged data for all neurons. E and F: average Bode plots for 10 neurons with GI inputs whose responses to rotations were recorded before (solid lines) and after (dashed lines) the intragastric administration of copper sulfate.

