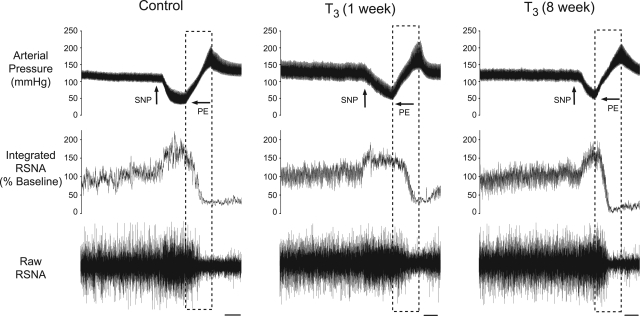
Fig. 4.
Representative tracings from rats in which BR testing was performed after either sham lesion, 1 wk following T3 left hemisection, or 8 wk following a T3 left hemisection. Tracings show the baseline AP, left RSNA, and the BR response in RSNA. Changes in AP for BR were induced by intravenous infusion of SNP and PE. Dashed boxes indicate the corresponding AP and RSNA used for baroreflex quantification. Scale bar = 30 s.

