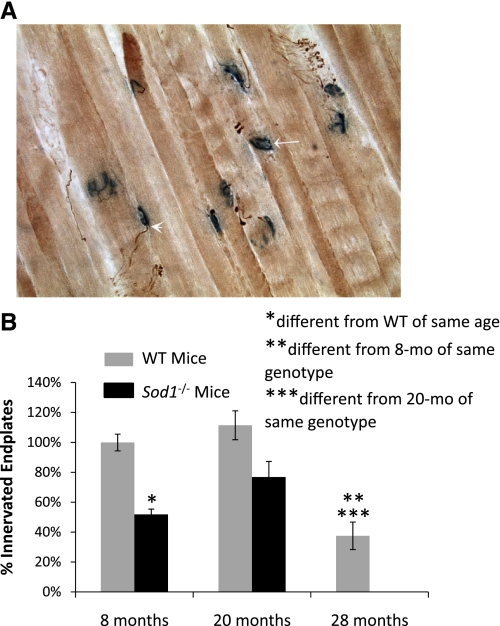
Fig. 5.
A: representative section is shown for GTN muscles assayed for acetylcholinesterase activity (blue) to visualize the motor end plate and costained with an antibody for neurofilament (brown) to visualize the motoneuron branches. Arrowhead indicates an end plate contacted by a nerve fiber, and a denervated end plate is indicated by the arrow. B: the number of motor end plates that are contacted by a nerve fiber was quantified and expressed as percentage of the total number of motor end plates in each section. Values are means ± 1 SE. Significant difference from *WT value at the same age, **8-mo-old mice of the same genotype, and ***20-mo-old mice of the same genotype: P < 0.05.

