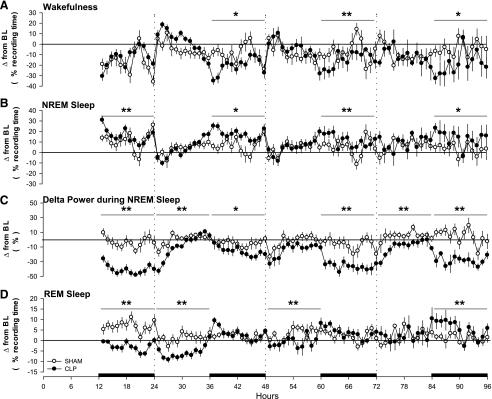
Fig. 2.
The changes in sleep and the EEG of rats are not due to the surgical procedure, but are a direct response to sepsis. Hourly differences between presurgical baseline values and postsurgical values were calculated and are plotted for each group relative to baseline values (depicted by the zero lines). Depicted are group differences in time spent in wakefulness (A), NREMS (B), EEG delta power (0.5–4.0 Hz) during NREMS (C), and REMS (D) for control rats (SHAM, ○) and septic rats (CLP, ●). Data are presented as means ± SE. Statistical evaluations were performed on consecutive 6-h time blocks. Statistically significant differences between groups across time blocks are indicated as *P ≤ 0.05; **P ≤ 0.01. The black bars on the x-axis indicate the dark portion of the light-dark cycle.

