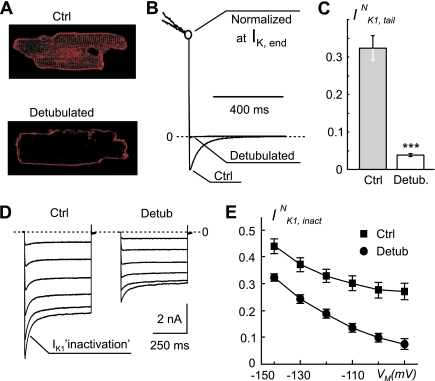
Fig. 3.
Effects of detubulated (Detub) on IK1,tail and IK1,inactivation. A: confocal images of control (Ctrl) and detubulated ventricular myocytes labeled with membrane specific dye di-4-ANNEPS. Detubulated leads to a loss of intramyocyte membrane labeling due to vesiculation of t tubules. B: current traces from randomly selected control and detubulated ventricular myocytes are normalized at the end of 400-ms voltage step to +50 mV to highlight significant decrease in the amplitude of IK1,tail in detubulated cells upon membrane repolarization to −75 mV. C: detubulated myocytes display nearly 8.5-fold reduction in IK1,tailN. n = 21 and n = 17 for control and detubulated, respectively. ***P < 0.001. D: representative records of IK1 measured in response to 500-ms voltage steps from −75-mV holding potential to potentials between −90 mV and −140 mV in control and detubulated myocytes. Prominent inactivation of IK1 in control myocytes is significantly decreased at all VM in detubulated cells. In addition, detubulated leads to significant decrease in total amplitude of IK1 (see results for detail). E: current traces in D were fit using two exponential function, and IK1,inactivation, IK1,inactN, was calculated as a ratio of the amplitude of time-dependent component of IK1 and the peak amplitude of IK1 at different VM. Detubulated leads to significant reduction in IK1,inactN at all VM. In D and E, n = 9 and n = 15 for control and detubulated, respectively.

