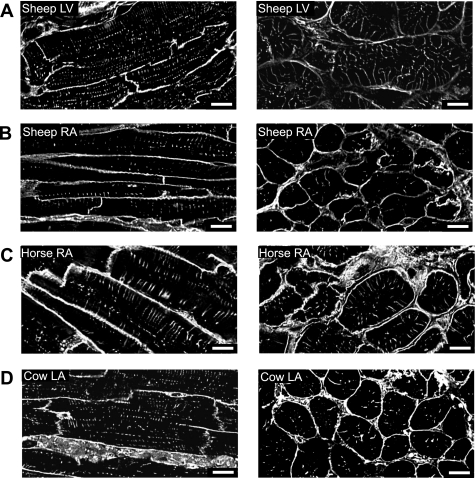
Fig. 1.
Surface and t-tubular membrane staining of ventricular and atrial tissue sections. Example deconvolved images of cell membranes in tissue sections labeled with wheat germ agglutinin (WGA). A–D, left: longitudinal view of sheep left ventricle (LV), sheep right atrium (RA), horse RA, and cow left atrium (LA), A–D, right: transverse sections of tissue in the same species. All scale bars are 10 μm and are shown at bottom right.

