Fig. 1.

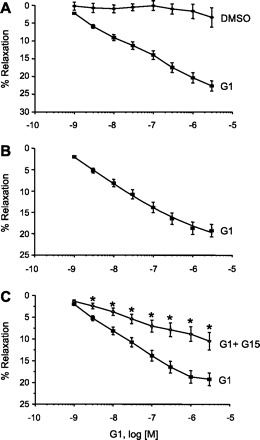
Stimulation of G protein-coupled estrogen receptor 1 (GPER) relaxes endothelium-denuded, precontracted coronary arteries. A: complete concentration-response relationship for G-1-induced relaxation. Each point represents the mean relaxation effect ± SE (n = 29). Top curve is a control concentration-response relationship in the presence of solvent (DMSO) alone (n = 6). B: actual G-1-induced relaxation response after normalization by subtracting the control component. C: complete concentration-response relationship for G-1-induced relaxation in the presence (○) or absence (■) of G15, a GPER antagonist. Each point represents the mean relaxation effect ± SE (n = 21). *P < 0.05.
