
Figure 3.
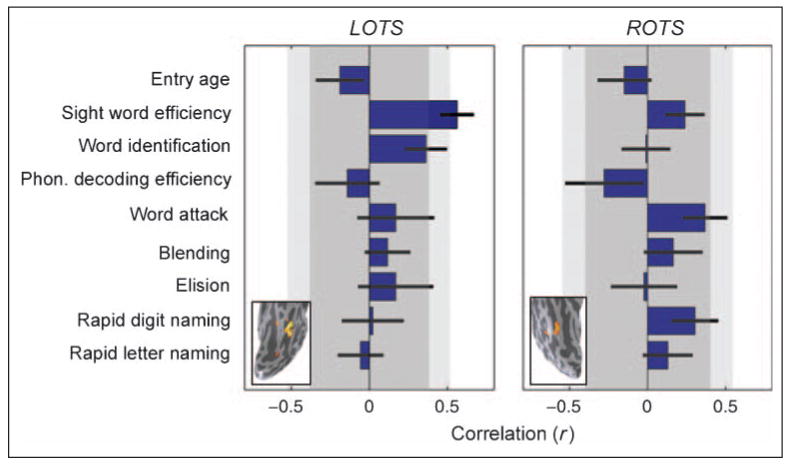
Correlations between behavioral change and cortical sensitivity change. Horizontal bars represent correlations between the change in sensitivity in LOTS (left) or ROTS (right) and the change in several cognitive measures. Error bars are computed by bootstrapping. Dark gray areas denote uncorrected two-tailed significance range of p > .05; light gray areas denote Bonferroni corrected two-tailed significance range of p > .05. Only the correlation between LOTS change and SWE change is significant with Bonferroni (or FDR) correction for multiple comparisons. Word identification is close to significance, but none of the other correlations are significantly different from zero. Insets show the location of the cortical regions in a single data set (S8, f, at age 12). Mean (± SD) MNI coordinates of ROI across individuals: LOTS (n = 28), [−49, −65, −9] (± 5, 8, 5) and ROTS (n = 25), [46, −67, −12] (± 6, 7, 4).