
Figure 4.
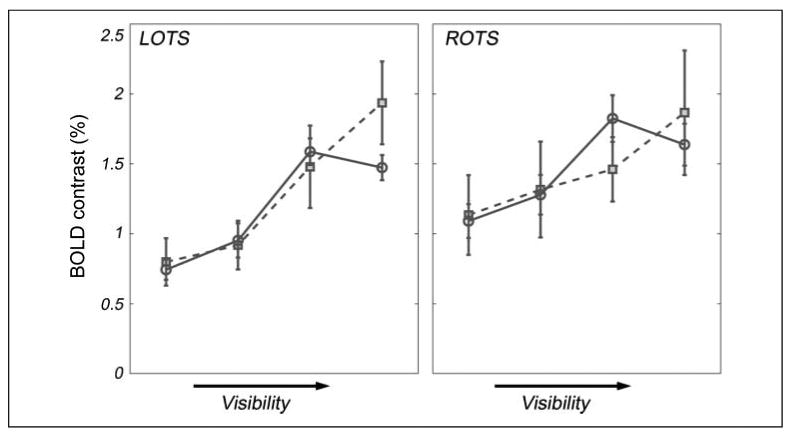
OTS word visibility curves grouped by reading skill. Dashed lines with square symbols depict mean curves for poor readers (basic reading standardized score < 90, mean age = 10.85, n = 7 participants contributing 14 curves); full lines with circular symbols depict mean curves for good readers (basic reading standardized score ≥ 100, mean age = 10.76, n = 26 participants contributing 58 curves). Error bars are calculated as SEM, wherein n is the number of unique participants (which is more conservative than the number of observations).