
Figure 5.
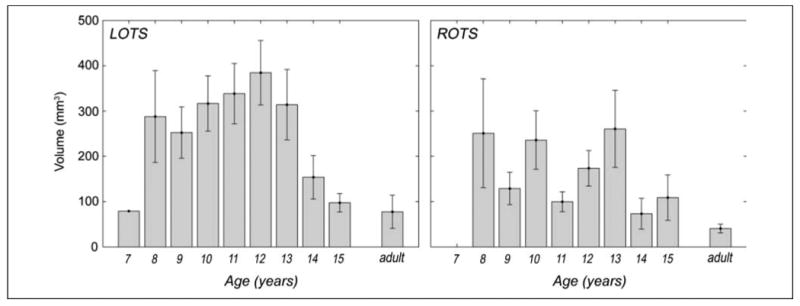
OTS activation volume varies by age. Bars show mean cluster volume for the word visibility contrast (two most visible word conditions vs. two least visible word conditions) for each age group (n = 1, 6, 11, 21, 28, 25, 18, 6, 4, 9, respectively) in LOTS and ROTS. Adult cluster volume calculated on data from Ben-Shachar et al. (2007). Error bars represent SEM.