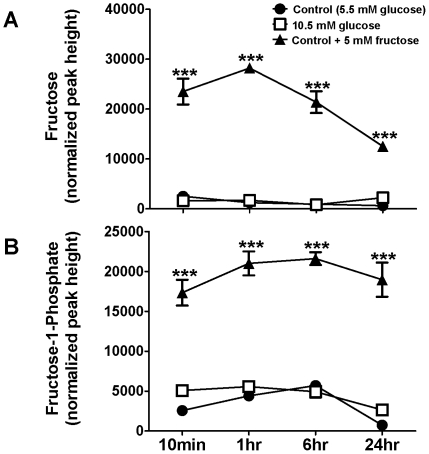
Figure 4. Concentrations of fructose metabolites in HepG2 cells incubated in the presence of glucose and fructose or glucose alone.
(A) Cellular levels of fructose in HepG2 cells grown in 5.5 mM glucose (control), 10.5 mM glucose, or 5.5 mM glucose+5 mM fructose for 48 hours before new media was added for 10 min, 1 hr, 6 hr, or 24 hr. (B) Levels of fructose-1-phosphate (F-1-P) in HepG2 cells grown in the three conditions described above. Units of intensity are quantifier ion peak heights. Means ± SEM are depicted. ***P<0.001 vs. controls; n = 5 or 6/group.

