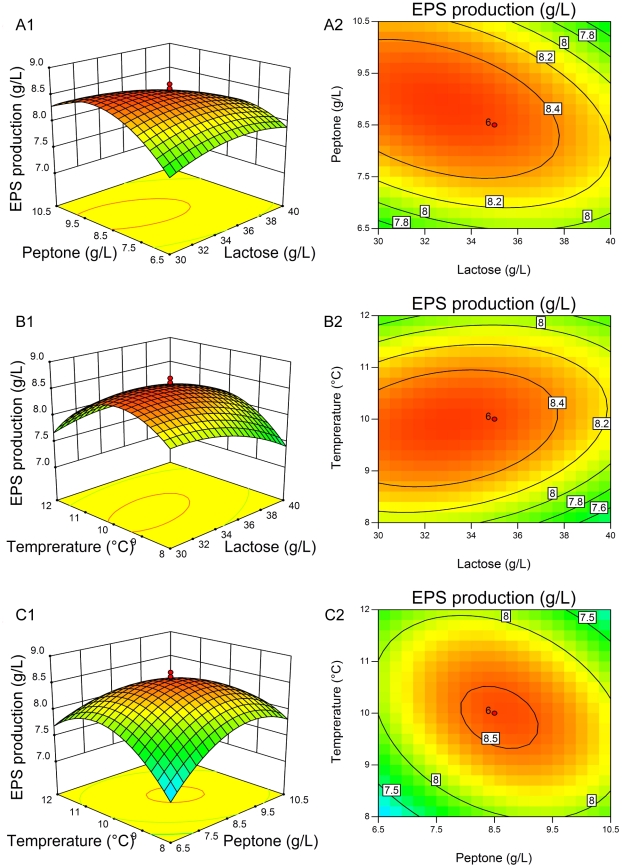
Figure 2. Three-dimensional plots and corresponding contour plots of the effect of three variables on EPS production.
When the effect of two variables was plotted, the other variable was set at the central level. A, interaction of lactose and peptone; B, interaction of lactose and temperature; C, interaction of peptone and temperature.

