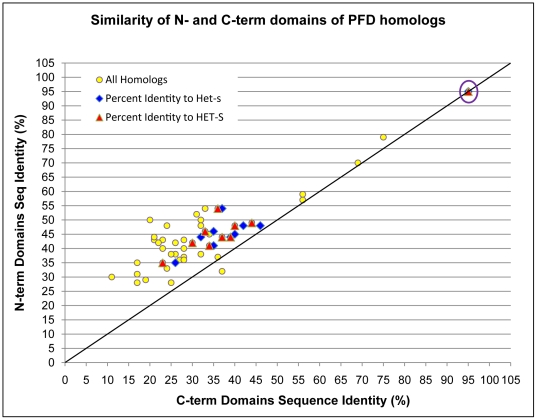
Figure 2. Graphical representation of the similarity matrix between N- and C-terminal homologs of the PFD.
Each point on the graph represents the percent similarity of the C-terminal domains and the N-terminal domains for a pair of PFD homologs. In addition to HET-s, ten PFD homologs are represented. Pairs of homologs that include the HET-s or HET-S proteins have been colored differently for comparison. Comparison of Podospora anserina sequences to each other are circled (purple).

