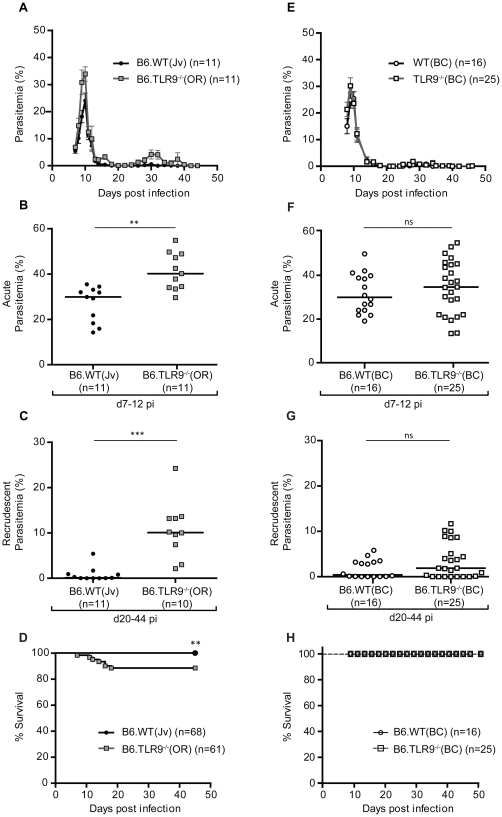
Figure 1. One additional backcross generation (B6.TLR9−/−(BC) and B6.WT(BC)) abolishes the phenotypic differences in the course of infection between B6.WT(Jv) and B6.TLR9−/−(OR) mice.
As detailed in materials and methods, B6.WT(Jv) mice were intercrossed with B6.TLR9−/−(OR) mice and heterozygotes (F1) were mated to obtain matched backcrossed B6.WT(BC) and B6.TLR9−/−(BC) mice. The offspring were used for experiments. B6.WT(Jv) (black circles), B6.TLR9−/−(OR) (grey squares), B6.WT(BC) (open circles) and B6.TLR9−/−(BC) (open squares) mice were infected ip with 104 PcAS pRBCs. (A,E) The course of parasitemia was monitored for 44 days by microscopic examination of thin Giemsa-stained blood smears. (B,F) Since not all mice reached their maximum peak parasitemia on the same day, the highest parasitemia of each individual mouse between day 7 and 12 was selected as peak parasitemia and indicated as a single dot. The horizontal lines indicate the group medians. (C,G) Since the timing of the recrudescences varied significantly between 20 and 44 days pi, the peak parasitemia values during recrudescences between day 20 and day 44 pi are shown and represented as single dots. The horizontal lines indicate the group medians. (D,H) Survival was monitored until 44 days pi in the four different groups. (A–C) Data are representative of more than three independent experiments with at least five mice per group in each experiment. (D) Data are a compilation of several experiments with at least five mice per group. (E–H) Data are a compilation of two independent experiments with at least seven mice per group at each time point. ns, not significant. The numbers of mice (n) in each group are depicted in the graph legend. **, p<0.01; ***, p<0.001.

