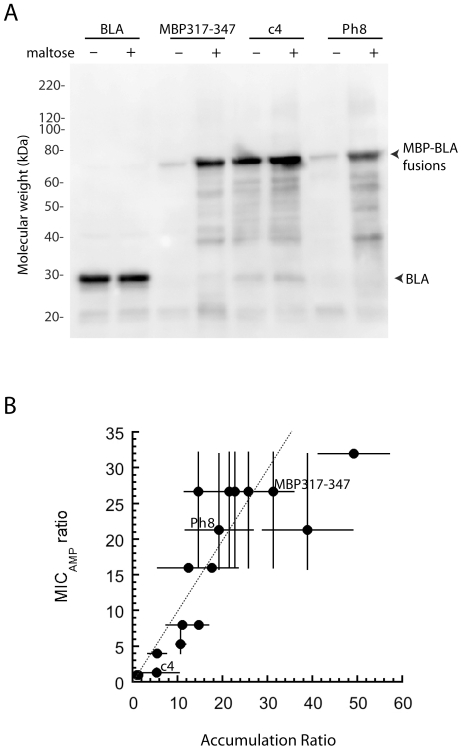
Figure 1. Characterization of phenotypic switches.
(A) Western blot using anti-BLA antibodies of the soluble fraction of cells expressing BLA (lower arrow, ∼30 kDa), MBP317-347, c4, and Ph8 (all upper arrow, ∼70 kDa) cultured in the presence (+) and absence (−) of 5 mM maltose. (B) Correlation between the accumulation ratio (+maltose/−maltose), as measured by western blot, and the MICAmp ratio (+maltose/−maltose) of cell expressing the 13 phenotypic switches, MBP317-347, c4 and BLA. The dotted line is y = x. Error bars represent the standard deviation (N = 3).

