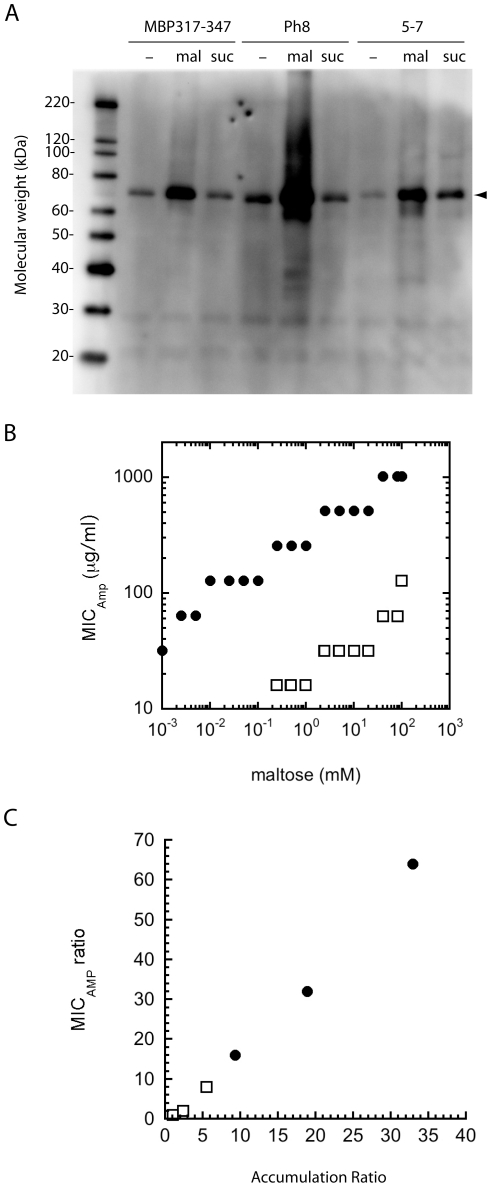
Figure 2. Effect of ligand concentration on MICAmp and accumulation of phenotypic switches.
(A) Western blot using anti-BLA antibodies of the soluble fraction of cells expressing MBP317-347, Ph8 and sucrose switch 5–7 (arrow, ∼70 kDa). Cells were cultured with maltose (mal), sucrose (suc), or neither sugar (−). (B) Correlation between the MICAmp and the concentration of maltose added to the culture for cell expressing MBP317-347 (•) or MBP317-347(W340A) (□). (C) Accumulation levels dictate the MICAmp. Correlation between the accumulation ratio (+maltose/−maltose), as measured by western blot, and the MICAmp ratio (+maltose/−maltose) of cell expressing MBP317-347 (•) or MBP317-347(W340A) (□). Different accumulation ratios were obtained by culturing the cells in the presence of different concentrations of maltose.

