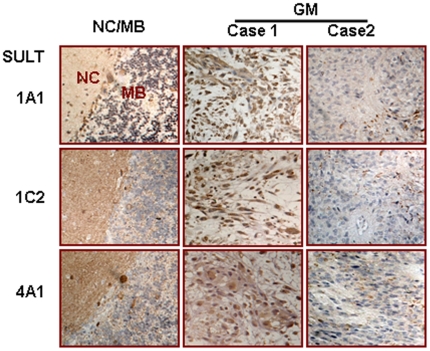
Figure 4. The expression of SULT1A1, 1C2 and 4A1 in glioblastomas tissues.
Immunohistochemical illustration of differential expression patterns of SULT1A1, 1C2 and 4A1 in two cases of glioblastomas (GM). Medulloblastoma (MB) and its surrounding noncancerous cerebellum tissue (NC) were cited as controls.

