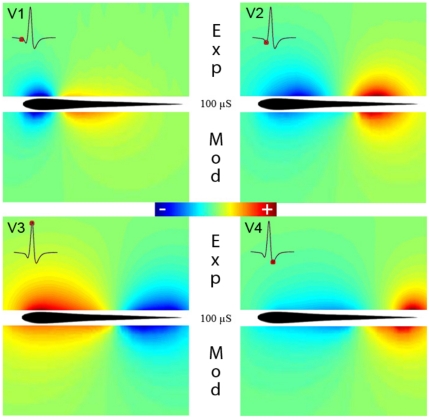
Figure 1. Comparison between experimental results and model predictions of the electric field generated by G. omarorum's EOD for a 100 µS/cm medium conductance.
The colormaps compare the fields of potential experimentally measured in a horizontal plane (upper half) at the peak of each component (V1 to V4, marked at the insets as a red dot in the head to tail EOD) with the same fields predicted by the model (lower half).

