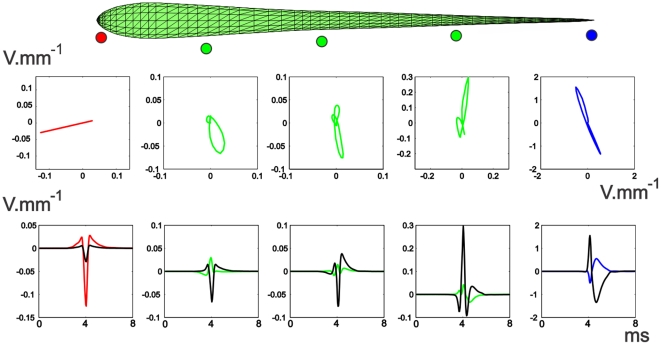
Figure 5. Pericorporal Local Electric Field.
Top: The time course of the electric field along the EOD, at different points on a horizontal plane, near the lateral skin of the fish. The colored dots indicate schematically the position in space where the field was calculated. Bottom: LEOD components at the same positions of the electric field. Colored traces correspond to longitudinal values and black traces to transversal values.

