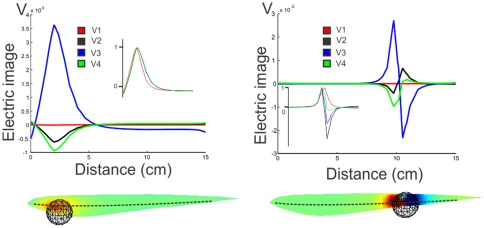
Figure 7. Images of a metal sphere.
Left: when the sphere is in the head region; Right: when it is close to the place where the field at the peak of V3 is zero. Top: images calculated along a line through the horizontal plane by the center of the sphere. Insets show the normalized images. Bottom: images on the skin of the fish, indicating the position of the sphere is shown by its image. The broken line on the fish indicates the line along which top images were plotted.

