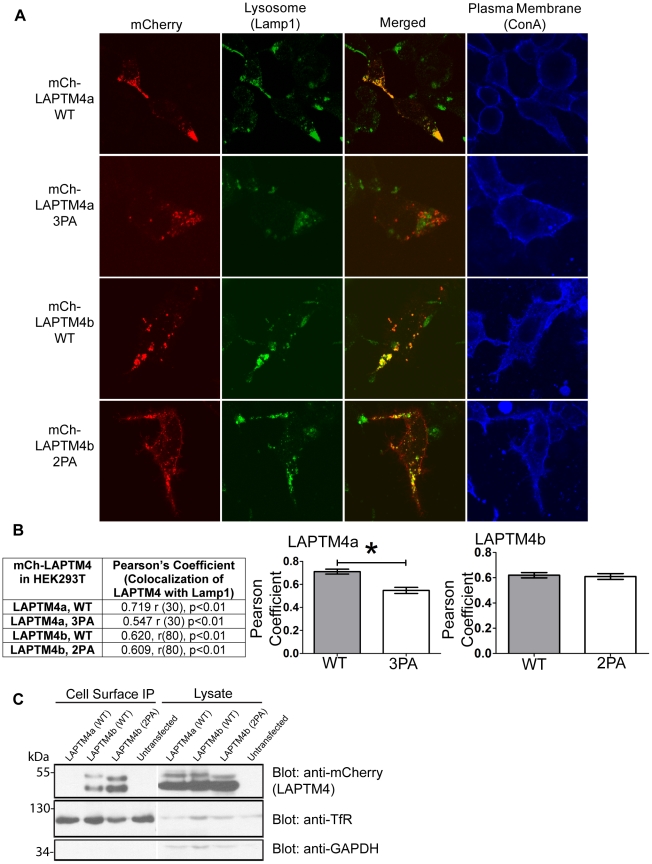
Figure 5. LAPTM4a and LAPTM4b require their PY motifs for proper targeting.
(A) 24 hrs post transfection the plasma membrane of Hek293T cells expressing mCh-LAPTM4a-WT, mCh-LAPTM4a-3PA, mCh-LAPTM4b-WT or mCh-LAPTM4b-2PA was stained (ConA, blue), cells were fixed, incubated with anti-Lamp1 antibodies (green) and imaged by confocal microscopy. Subcellular localization of LAPTM4 was assessed using Volocity 5.4.1. (B) LAPTM4 colocalization with the lysosomal marker Lamp1 is expressed in terms of the Pearson's correlation coefficient. Degrees of freedom are noted as (r), level of significance as (p). Graphs illustrate changes in the mean Pearson's coefficients of mCh-LAPTM4 colocalization with Lamp1 (LAPTM4a n = 32, LAPTM4b n = 82). Error bars indicate SEM. * denotes p<0.0001. (C) Cell surface expression of mCh-LAPTM4b-2PA is up-regulated relative to that of mCh-LAPTM4b-WT. Cell surface biotinylation was performed on Hek293T cells expressing mCh-LAPTM4a-WT, mCh-LAPTM4b-WT or mCh-LAPTM4b-2PA. Cell surface biotinylation of Transferrin receptor (TfR) served as a positive control, while cell surface biotinylation of mCh-LAPTM4a-WT and GAPDH served as negative controls.

