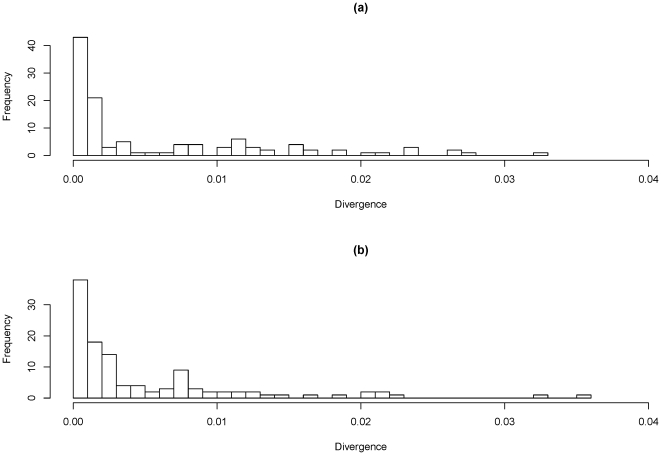
Figure 3. Plot of frequency of mutational differences per gene.
(a) Differences are shown for the two ST-474 isolates and, (b) of H22082 against the reference genome. Divergence shown for the genes at which the two ST-474 differed. For the latter comparison, each gene was compared with the reference genome whose gene sequence was the most similar.

