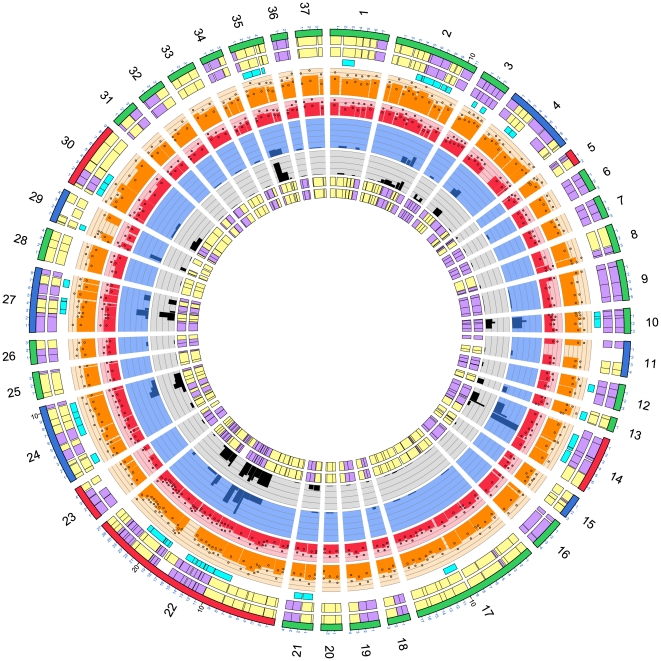
Figure 4. Circos plot of orthologous genomic regions for the two ST-474 genomes where sequence differences are found.
The figure shows 37 detectable regions. Orthologous gene pairs in P110b and H22082 were calculated using OrthoMCL with a ‘pi_cutoff’ value of 0.95. The tracks from outside to inside are; genome region name and size (green, regions of same length in P110b and H22082; blue, the region from P110b is longer; red, the region from H22082 is longer); genes and sizes for P110b; genes and sizes for H22082; genes coloured cyan showing evidence of recombination; histograms for P110b (orange) and H22082 (red) showing the nucleotide coverage from the short reads plotted as an average over the length of the gene, along with the standard deviations for the coverage as round circles; histograms showing the number of sequence differences between the genes at the protein level (dark blue on a light blue background) and DNA level (black on a grey background) as a fraction of protein or gene length respectively; a repeat of the gene sizes and locations in P110b and H22082. Gene orientations are shown in purple and yellow for the forward and reverse strand respectively. The nucleotide coverage histograms have the same scale but a different magnitude, 180 and 120 for P110b and H22082 respectively. Similarly the sequence difference histograms have the same scale but a different magnitude, 0.05 and 0.04 for the protein and the DNA histograms respectively.

