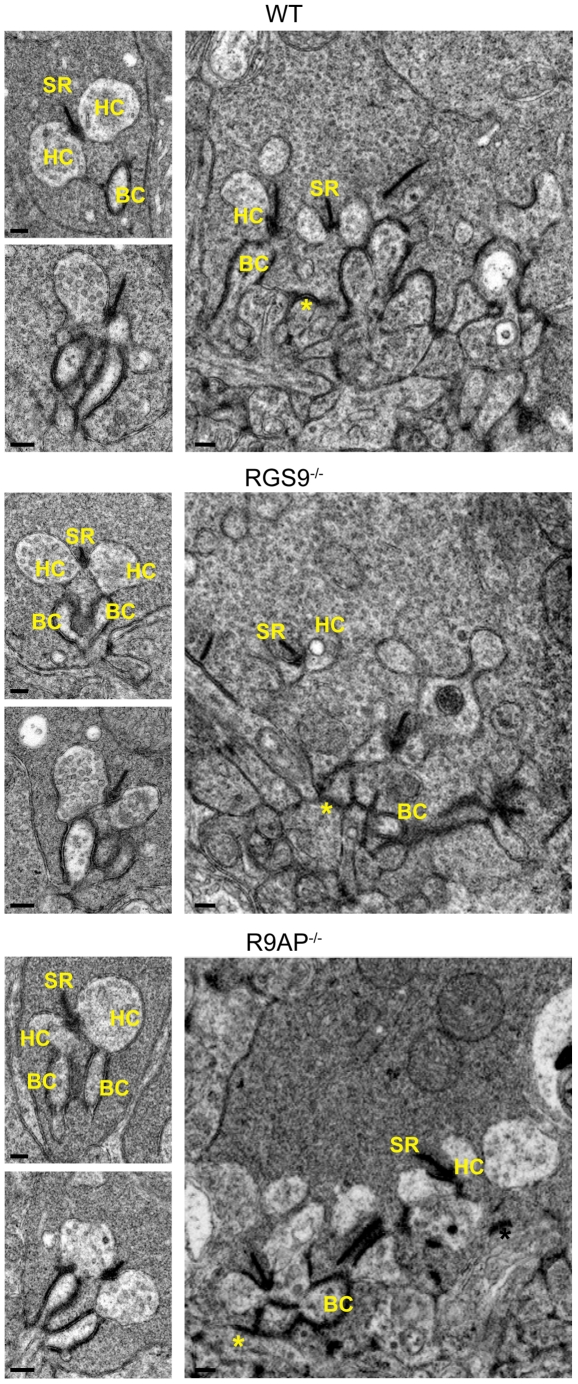
Figure 2. Electron microscopy analysis of rod and cone synaptic terminals in WT, RGS9 −/− and R9AP −/− mice.
Shown are representative electron micrographs of cross-sections through rod spherules (smaller images on the left) and through the base of cone pedicles (right). At least 60 rod spherules and 10 cone pedicles were analyzed for each mouse type. Abbreviations are: SR – synaptic ribbon, HC – horizontal cell process, BC – bipolar cell dendrite. Asterisks indicate flat synaptic contacts at the cone terminals. Scale bars: 200 nm.

