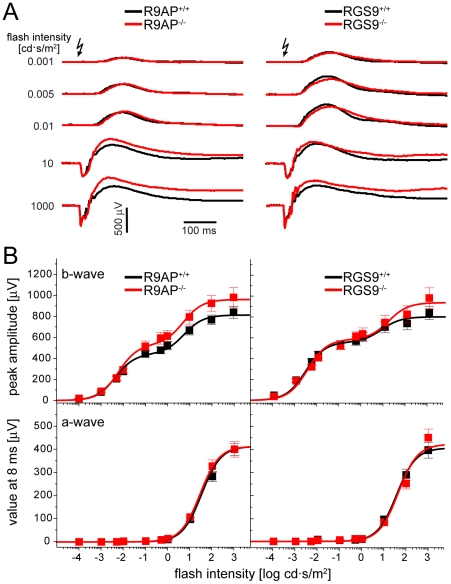
Figure 3. ERG responses of R9AP −/− and RGS9 −/− mice.
(A) ERG recordings from R9AP −/− or RGS9 −/− mice (red) and their corresponding WT littermates (black) were averaged from all recordings evoked by a given flash intensity. Arrows indicate the time when light flash was applied. (B) Stimulus-response curves of b-wave amplitudes (upper panel) and a-wave values measured at 8 ms after the flash, a time point preceding the b-wave onset (lower panel). Data for each knockout mouse are shown in red, data for WT littermates are shown in black. Data points (mean ± SEM) were fitted using Equation 1 (Materials and Methods); fitting parameters are summarized in Table 1. The data were averaged from 13 eyes of R9AP −/−; 13 eyes of R9AP +/+; 7 eyes of RGS9 −/−; and 7 eyes of RGS9 +/+ mice.

