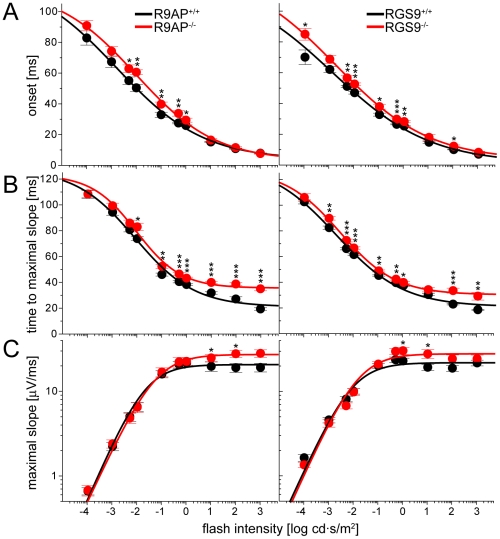
Figure 5. Plots of three parameters characterizing the rising phases of b-waves as functions of flash intensity.
(A) Time of b-wave onset. (B) Time required to reach the maximal slope of the rising b-wave. (C) The value of maximal b-wave slope. The data in (A) and (B) were fitted by Equation 2 (fitting parameters are summarized in Tables 2 and 3, respectively); the data in (C) were fitted to Equation 3 (fitting parameters are summarized in Table 4). The statistical significance of the difference between the pairs of mean values obtained from knockout mice and their WT littermates was determined by a paired independent t-test, yielding p-values marked as follows: (*) p<0.05; (**) p<0.01; (***) p<0.001.

