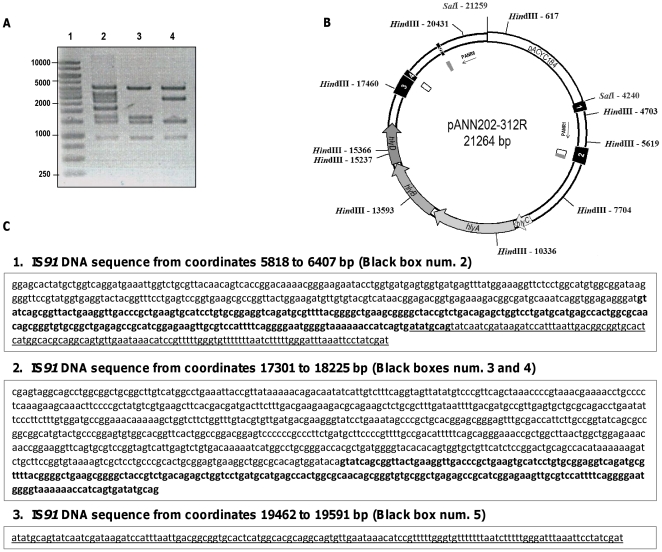
Figure 2. Mapping of the IS91 directed repeats that generate the two deletion patterns observed.
A. HindIII restriction analysis of pANN202-312R plasmid DNA (lane 2) and plasmid DNA isolated from two Hly- clones exhibiting the two different deletion patterns identified (lanes 3 and 4, deletions 1 and 2 respectively). Lane 1 corresponds to the molecular mass marker. B. Physical map of plasmid pANN202-312R. HindIII and SalI restriction sites and their corresponding coordinates are shown. Black boxes 1 to 5 correspond to the five partial IS91 sequences that flank the hly genes. Internal grey boxes correspond to IS91 direct repeats generating deletion 1. Internal white boxes correspond to IS91 direct repeats generating deletion 2. C. DNA sequences of both IS91 direct repeats that flank the deletions. Box 1 shows the DNA sequence corresponding to IS91-2 from coordinates 5818 to 6407. The direct repeat generating deletion 1 is shown underlined. The direct repeat generating deletion 2 is shown in bold. Box 2 corresponds to the DNA sequences of IS91-3 and 4. The direct repeat generating deletion 2 is shown in bold. Box 3 corresponds to the DNA sequence of IS91-5. The direct repeat generating deletion 1 is shown underlined.

