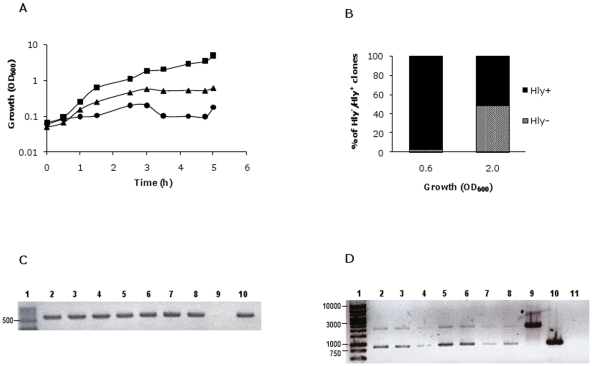
Figure 6. Subinhibitory km concentrations result in deletion of Hly sequences in strain MG1655 (pHly152).
A. Growth curves of strain MG1655 (pHly152) in LB medium containing no km ( ), 5 (
 ) and 10 (
 ) mg/l of km. B. The percentage of Hly- clones in the culture grown in LB km (5 mg/l). C. PCR analysis using primers PANR8 and NBM18 to confirm the presence of pHly152 in seven Hly- clones (lanes 2 to 8). Lane 1, molecular mass marker. Lane 9, negative control (strain MG1655). Lane 10, positive control (strain MG1655 (pHly152)). D. PCR analysis to confirm deletions 1 and 2 in the Hly- clones. Primers used were PANR1 and PANR6, and the fragments amplified were of 875 bp and 2126 bp for the deletions 1 and 2 respectively.

